
Want to bring your project to life—literally? Whether you’re building a fitness tracker, a responsive art installation, or an interactive game, measuring real-time heart rate is a great way to make your work more personal and dynamic. That’s where the Pulse Sensor comes in.
The Pulse Sensor is a small, lightweight, and low-power heart-rate sensor designed specifically for Arduino users. It’s plug-and-play, meaning you can get started quickly without needing complex setup. Thanks to its compact, button-sized design with sewable holes, you can even integrate it into wearable tech and smart textiles.
In this hands-on tutorial, you’ll learn how the Pulse Sensor works, how to connect it to an Arduino, and explore several practical examples, including live heart rate plotting and calculating beats per minute (BPM).
Let’s get started!
Did you know?
The Pulse Sensor is an open-source device developed by the team at PulseSensor.com. It started as a Kickstarter project in 2011, and by 2013, it had attracted 491 backers who pledged $18,418 to help bring the idea to life.
Hardware Overview
On the front of the Pulse Sensor, you’ll see a heart logo. This is where you place your finger to measure your pulse. You’ll notice a small circular window here where a green LED (made by Kingbright) shines through.

Right under this window is a special light sensor called the APDS-9008 (made by Avago). This is an ambient light sensor, like the ones used in smartphones, tablets, and laptops that automatically adjusts screen brightness based on room lighting.
On the back of the Pulse Sensor, you’ll find some key electronic components:
- An MCP6001 operational amplifier (Op-Amp) from Microchip. This boosts the tiny electrical signals from the light sensor so they can be read easily by a microcontroller.
- A few resistors and capacitors that work together as an R/C filter. This filter helps clean up the signal by removing unwanted noise or interference.
- A reverse protection diode that keeps the sensor safe if you accidentally connect the power wires backward.

The Pulse Sensor works with a DC power supply of 3.3 to 5 volts and uses less than 4 mA of current.
Technical Specifications
Here are the specifications:
| Maximum Ratings | VCC | 3.0 – 5.5V |
| IMax (Maximum Current Draw) | < 4mA | |
| VOut (Output Voltage Range) | 0.3V to Vcc | |
| Wavelength | LED Output | 565nm |
| Sensor Input | 525nm | |
| Dimensions | L x W (PCB) | 15.8mm (0.625″) |
| Lead Length | 20cm (7.8″) |
How Does a Pulse Sensor Work?
Have you ever shined a flashlight through your fingers and noticed how you can see your heartbeat? This is the same idea behind how pulse sensors work!

A Pulse Sensor works by shining a green light onto a thin part of your body, like your fingertip or earlobe. These areas are perfect because the skin is thin enough for light to pass through easily. When the light travels through your skin, some of it gets absorbed by your blood, and the rest bounces back. The Pulse Sensor has a special part called a photodetector that measures how much light returns. This process has a big name – Photoplethysmography (PPG) – which just means measuring changes in blood volume using light.

Here’s what happens:
Your blood contains a protein called hemoglobin that carries oxygen around your body. When hemoglobin is carrying oxygen (called oxygenated hemoglobin or HbO2), it absorbs more green light.
Each time your heart beats, it pumps fresh, oxygen-rich blood into your finger. Since this blood has lots of oxygenated hemoglobin, it absorbs more light. This means less light bounces back to the photodetector.
Between heartbeats, there’s slightly less oxygenated blood in your finger. So less light gets absorbed, and more light reaches the detector.
This means the photodetector can pick up tiny changes in the amount of light reflected with each heartbeat, creating a wave-like pattern that matches your heartbeat.
The signal from the photodetector is typically small and noisy. To make it better, the signal passes through an R/C filter that cleans it up. Then, it goes through an operational amplifier (Op-Amp) to make the signal much larger, and easier to detect.
Why green light?
Green light works great because hemoglobin absorbs it well, making it good at showing blood flow changes during each heartbeat. Also, green light is less affected by ambient light compared to red or infrared light, so it has less noise in the signal.
Pulse Sensor Pinout
The Pulse Sensor comes with a 20 cm flat ribbon cable with three male header pins that connect to an Arduino or other microcontroller:

S (Signal) is the analog output signal from the sensor. You connect it to an analog input pin on the Arduino, such as A0.
+ (VCC) This is the power input pin. Connect it to either 3.3V or 5V from the Arduino.
– (GND) This is the ground pin.
The cable colors can be different on various Pulse Sensors, so always check the labels on the back of your sensor to make sure you know which wire is which.
Wiring a Pulse Sensor to an Arduino
Connecting the Pulse Sensor to an Arduino is simple. You only need to connect three wires: two for power and one for the signal.
You can power the sensor with either 3.3V or 5V. So, connect the + pin of the Pulse Sensor to the 3.3V or 5V pin on the Arduino. Connect the – pin to GND on the Arduino. Finally, connect the S pin to A0 (or any other analog input pin) on the Arduino.
Here’s a quick reference table for the pin connections:
| Pulse Sensor | Arduino | |
| + (VCC) | 5V | |
| – (GND) | GND | |
| S (Signal) | A0 |
Here’s how to wire up the Pulse Sensor:

Library Installation
To run the following sketches, you must first install the PulseSensor Playground library.
To install the library,
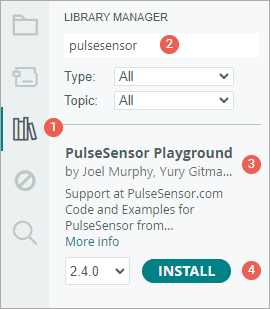
- First open your Arduino IDE program. Then click on the Library Manager icon on the left sidebar.
- Type “pulsesensor” in the search box to filter your results.
- Look for the PulseSensor Playground Library.
- Click the Install button to add it to your Arduino IDE.
PulseSensor Example Sketches
The PulseSensor library comes with several ready-to-use example sketches. These examples help you understand how the sensor works and give you ideas for your own projects.
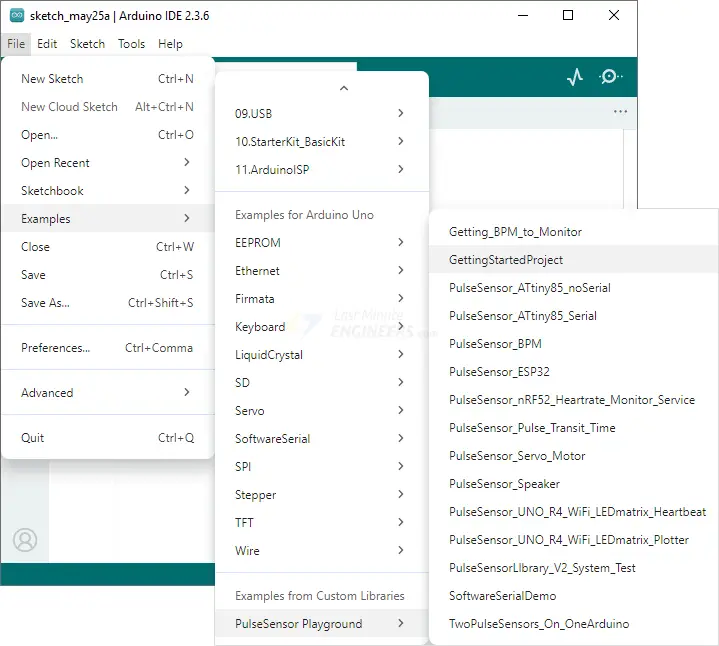
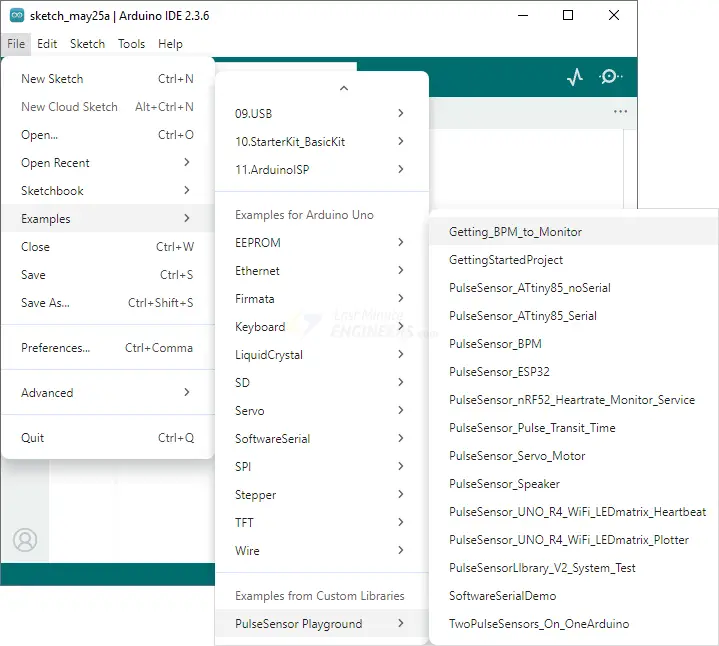
To find these example sketches, open the Arduino IDE and go to File > Examples > PulseSensor Playground.
You will see a selection of example sketches. Feel free to explore them, but let’s start with the GettingStartedProject.
Arduino Example 1 – Blink with the Heartbeat
This first example shows you how to read the Pulse Sensor and make the built-in LED on your Arduino board blink in rhythm with your heartbeat!
int const PULSE_SENSOR_PIN = 0;  // 'S' Signal pin connected to A0

int Signal;           // Store incoming ADC data. Value can range from 0-1024
int Threshold = 550;  // Determine which Signal to "count as a beat" and which to ignore.

void setup() {
  pinMode(LED_BUILTIN, OUTPUT);  // Built-in LED will blink to your heartbeat
  Serial.begin(9600);            // Set comm speed for serial plotter window
}

void loop() {
  Signal = analogRead(PULSE_SENSOR_PIN);  // Read the sensor value

  Serial.println(Signal);  // Send the signal value to serial plotter

  if (Signal > Threshold) {  // If the signal is above threshold, turn on the LED
    digitalWrite(LED_BUILTIN, HIGH);
  } else {
    digitalWrite(LED_BUILTIN, LOW);  // Else turn off the LED
  }
  delay(10);
}
After you upload the sketch to your Arduino, place your finger gently on the sensor and try to keep your finger still. You’ll see the built-in LED on your Arduino start blinking with each heartbeat.
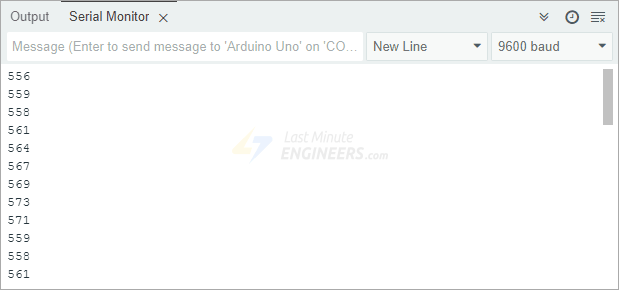
You can also open the Serial Monitor to see the raw data coming from the Pulse Sensor.
Code Explanation
First, we tell the Arduino which analog pin connects to the Pulse Sensor—in this case, analog pin 0.
int const PULSE_SENSOR_PIN = 0;Then, we create two important variables. The first variable stores the analog signal from the sensor, which gives you values between 0-1024 based on the voltage levels it reads. The second variable sets a threshold value that helps decide if there’s a heartbeat or not. When the signal is above this number, it means we just detected a pulse.
int Signal;
int Threshold = 550;
In the setup section, we configure the built-in LED pin (pin 13) to behave as an output and initialize the serial communication.
void setup() {
  pinMode(LED_BUILTIN, OUTPUT);
  Serial.begin(9600);
}
In the loop section, we read the analog data from the Pulse Sensor. We then compare that reading to our predefined threshold value. If the signal is higher than the threshold—meaning we detected a pulse—we turn the LED on. If it’s lower than the threshold, we turn the LED off. We add a tiny delay so the Arduino doesn’t read the signal too quickly.
void loop() {
  Signal = analogRead(PULSE_SENSOR_PIN);  // Read the sensor value

  Serial.println(Signal);  // Send the signal value to serial plotter

  if (Signal > Threshold) {  // If the signal is above threshold, turn on the LED
    digitalWrite(LED_BUILTIN, HIGH);
  } else {
    digitalWrite(LED_BUILTIN, LOW);  // Else turn off the LED
  }
  delay(10);
}
Arduino Example 2 – Heart Beat Plotting
In the first example, you saw the raw numbers coming from the Pulse Sensor using the Serial Monitor. While these numbers represent your heartbeat signal, they can be hard to understand just by looking at them. A much better way to visualize your heartbeat is to plot the data as a graph using the Arduino Serial Plotter.
To see this graph, make sure the previous sketch (GettingStartedProject) is still running on your Arduino. Then, in the Arduino IDE, go to Tools > Serial Plotter. After a few seconds, you should start to see the live waveform of your heartbeat appearing on your screen.
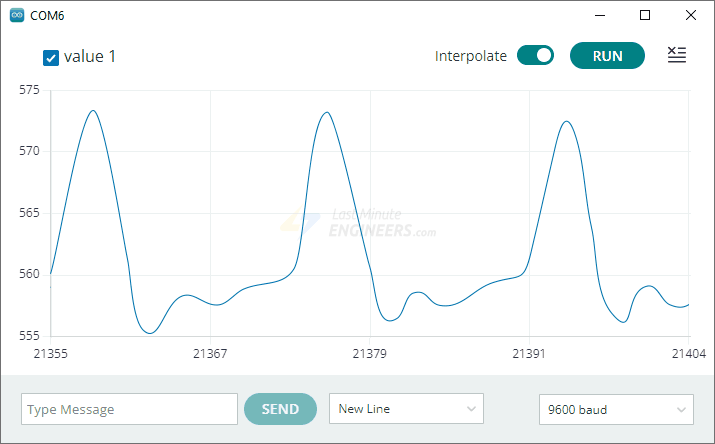
At first, the signal might look a little unstable, but don’t worry — it should settle down after a short time. Once it stabilizes, you’ll notice regular peaks and dips in the graph. These peaks represent each heartbeat. You can even place your fingers on your wrist to feel your pulse while watching the graph, and compare your actual heartbeat with the signal shown on the screen.
Trouble Seeing a Heartbeat?
If the graph doesn’t show your heartbeat clearly, don’t panic — there are several things you can check and try to improve the signal.
- First, make sure you’re placing your finger correctly on the sensor. If you press too hard, you might squeeze most of the blood out of your finger, and the sensor won’t detect anything. If you press too softly, the sensor may pick up movement or background light, causing a noisy signal. You need to find the “sweet spot” — just enough pressure to keep your finger still without cutting off circulation.
- Remember that changes in pressure affect how much blood flows in your finger, which can confuse the sensor. To get a steady reading, try holding the sensor in place with a rubber band or some tape so the pressure stays constant while you’re taking measurements.
- If the sensor still isn’t working well on your fingertip, try testing it on other parts of your body where blood flow is easy to detect, like your earlobe or lower lip. These areas also have blood vessels close to the surface and often give better results.
Arduino Example 3 – Measuring Heart-Rate (BPM)
In this third example, we’re going to take things a step further by actually measuring your heart rate in beats per minute (BPM) – similar to what fitness trackers and smartwatches do.
To try this yourself, open the Arduino IDE and load the Getting_BPM_to_Monitor sketch from the PulseSensor Playground examples menu.
This sketch works by calculating the time between each heartbeat detected by the sensor. By measuring how much time passes from one beat to the next, the program can figure out how many beats would happen in a full minute — which is exactly what BPM means.
Warning:
This sensor uses light to detect your pulse. Many things can affect the readings, like movement or how you place your finger. So it’s great for learning and experimenting, but not reliable for medical use.
#define USE_ARDUINO_INTERRUPTS true  // Set-up low-level interrupts for most acurate BPM math
#include <PulseSensorPlayground.h>   // Includes the PulseSensorPlayground Library

const int PulseWire = 0;  // 'S' Signal pin connected to A0
const int LED13 = 13;     // The on-board Arduino LED
int Threshold = 550;      // Determine which Signal to "count as a beat" and which to ignore

PulseSensorPlayground pulseSensor;  // Creates an object

void setup() {
  Serial.begin(9600);

  // Configure the PulseSensor object, by assigning our variables to it
  pulseSensor.analogInput(PulseWire);
  pulseSensor.blinkOnPulse(LED13);  // Blink on-board LED with heartbeat
  pulseSensor.setThreshold(Threshold);

  // Double-check the "pulseSensor" object was created and began seeing a signal
  if (pulseSensor.begin()) {
    Serial.println("PulseSensor object created!");
  }
}

void loop() {
  int myBPM = pulseSensor.getBeatsPerMinute();  // Calculates BPM

  if (pulseSensor.sawStartOfBeat()) {              // Constantly test to see if a beat happened
    Serial.println("♥  A HeartBeat Happened ! ");  // If true, print a message
    Serial.print("BPM: ");
    Serial.println(myBPM);  // Print the BPM value
  }

  delay(20);
}
Once you upload the sketch to your Arduino, open the Serial Monitor to see the results.
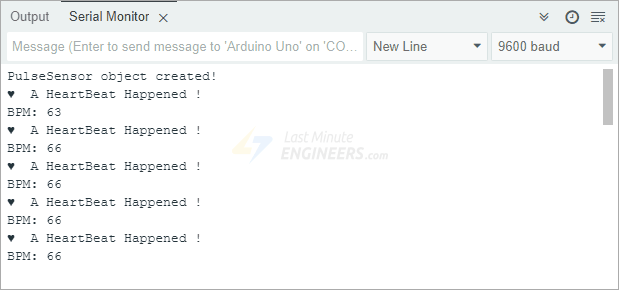
You might notice that the numbers seem a little strange at first. That’s totally normal. It usually takes a few seconds for the sensor to lock onto your pulse and start giving steady readings.
Heartbeat Visualizer
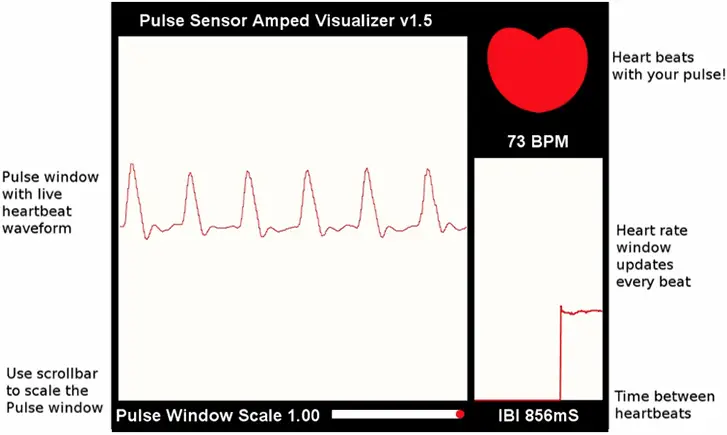
For this final example, you’ll be using a special program called Processing Visualizer to see your heartbeat on your computer screen in real time! The Pulse Sensor team created this program using the Processing programming language. You’ll watch your heartbeat as a moving graph, see your Beats Per Minute (BPM), and view the Interbeat Interval (IBI)—the time between each heartbeat.
It’s important to know that this Processing sketch does not do any of the calculations itself. All the hard work — like detecting beats, measuring BPM, and calculating IBI — is done by the Arduino. The Processing program’s only job is to read the data from the Arduino’s serial port and display it in a visual way.
Uploading the Arduino Sketch
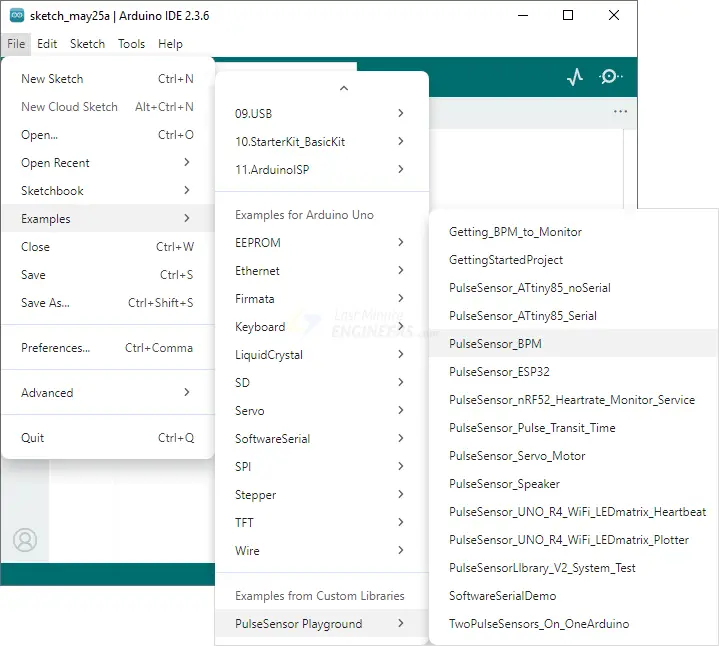
To get started, you first need to upload the right sketch to your Arduino. In the Arduino IDE, go to File > Examples > PulseSensor Playground and select the sketch called PulseSensor_BPM.
Before uploading the sketch, you need to make one small change in the code. Look for a variable called OUTPUT_TYPE. By default, it is set to SERIAL_PLOTTER, which is used for the Arduino Serial Plotter. But for the Processing Visualizer to work, you must change this value to PROCESSING_VISUALIZER.
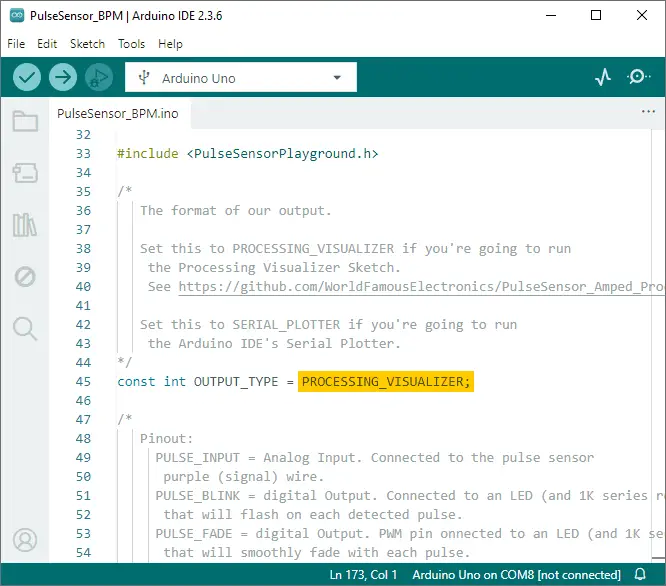
Once you’ve made that change, upload the sketch to your Arduino. Now your Arduino is ready to send your heartbeat data in a format that the Processing Visualizer can understand!
Setting Up the Processing Visualizer
Next, you need to download the Processing Visualizer program. You can find it on GitHub. After downloading it, unzip the folder, and take the folder called PulseSensorAmpd_Processing_Visualizer and place it in your Documents > Processing folder.
Next, open the Processing IDE program. Go to File > Sketchbook.
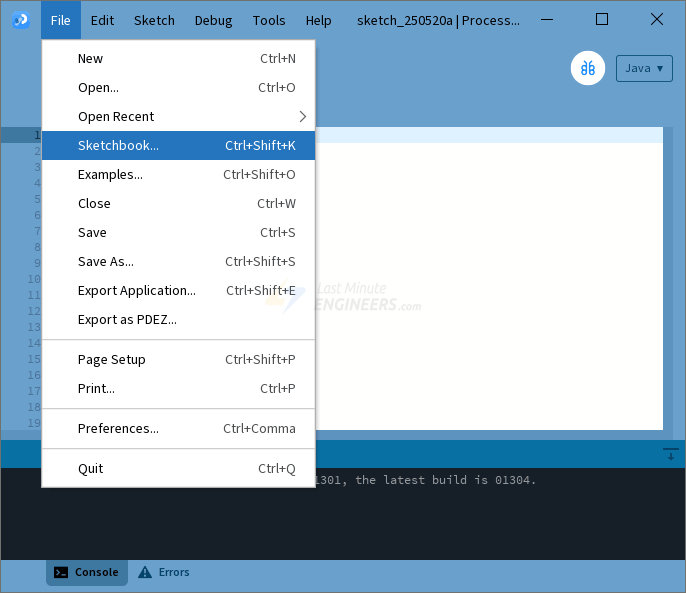
You should see the PulseSensorAmped_Processing_Visualizer in the list. Click on it to open the program.

Setting Up the Visualizer
When you run the program in Processing, you will be prompted to select the USB port that your Arduino is connected to. If you don’t see your Arduino in the list right away, just click the “Refresh Serial Ports List” button.

Once you select the correct port, the program will start showing your heartbeat data in real time!
Cool Features You Can Use
While watching your heartbeat, you can do a few extra things:
- Press the ‘s’ key on your keyboard to take a screenshot of the screen. The screenshot will be saved as a .jpg image in your sketch folder.
- Press the ‘r’ key to clear the display and start fresh. This is helpful if you want to restart the graph or begin a new recording.